Columbia Basin Salmon and Steelhead Crosswalk Project
Welcome to the Crosswalk!
This web site has links to two online mapping tools and a fish names query system, which provides access to geographic and descriptive information on fish populations (pop/units) of salmon and steelhead as defined by state and federal agencies, tribes, and regional projects in the Columbia Basin. Many fish managers in the region have devised their own naming schemas for these pop/units and the schemas may not be consistent among the fish managers. Other inconsistencies may include differences in: descriptions of runs, pop/units groupings, geographic mapped areas, and which pop/units are recognized by a managing agency. Using the tools found on this web site, fish managers can crosswalk their organizations’ pop/unit boundaries with the pop/unit boundaries of others and determine if the data collected and reports written describe the same pop/unit. For an in depth description of the project, see the Final Report or the original Project Proposal.
Using the Tools
There are four ways to query and receive information on pop/units including:1.Species Maps, 2. HUC6 Maps, 3. database query system that returns pop/unit names by fish manager (data source), and 4. REST endpoint. Several maps and the query tool can be opened at the same time in different tabs for comparing.
The mapping applications user guide has been created to explain the tools and how to use them.
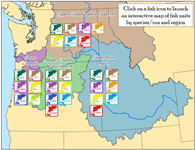 Species Maps– Currently this map is offline for future upgrades. The tabular data can still be accessed in the Population Query tool and the spatial data can be accessed at https://gis.critfc.org/arcgis/rest/services. This interactive mapping tool displays the whole boundary for each pop/unit defined by agency or regional project, based on HUC6 subwatersheds. Additionally, view data reported with each species within the pop/units. The pop/units are grouped by species (Chin = Chinook, Sthd = Steelhead, Sp = Spring, Su = Summer, Fa = Fall, Wi = Winter) within four regions in the Columbia Basin (Lower Columbia – below Bonneville Dam, Middle Columbia – between Bonneville Dam and the Snake River, Upper Columbia – above the Snake River, and the Snake River).
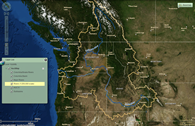 HUC6 Map – Currently this map is offline for future upgrades. The tabular data can still be accessed in the Population Query tool and the spatial data can be accessed at https://gis.critfc.org/arcgis/rest/services. This interactive mapping tool displays the boundaries of 6th level Hydrologic Unit Code (12 digit Subwatersheds) within the Columbia Basin that are associated with a pop/unit of salmon or steelhead. The selection of any one of the HUC6s will return a report of all species and pop/units names and tabular data that are linked to the subwatershed.
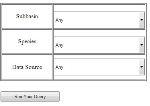 Population Query – Using this tool, one can query the pop/units database to return a list of pop/units that meet select criteria (such as sharing a mapped area) . Links are provided to view reports containing the pop/units attributes and HUC6 list of geographic extent.
Data
The project has a variety of pop/units collected and converted to be used with the national Watershed Boundary Dataset (WBD). The WBD is a fairly new hydrological boundary dataset and therefore not all of the spatial datasets on pop/units used by managers that used the old hydrological data have been converted to the WBD. Other datasets from some of the agencies or tribes also needed to be transferred from line work of stream/river distribution to the polygons of the WBD for use in this project.
The fish pop/unit data are accessible directly as map services through a REST endpoint, for users who wish to add them to their GIS, instead of querying them with the tools listed above. The REST endpoint address is: https://gis.critfc.org/arcgis/rest/services. The populations are first separated as distinct map services by regional geographic area and species/run, and then as distinct layers by data source and local geographic area.
SOURCE OF FISH UNIT/POPULATION DATA:
Listed below are a set of acronyms and information for Columbia Basin processes or agencies and tribes that provided data for this project. The acronyms will appear in the Source field within the Fish Units Subwatershed report that is generated when the ID tool is used on a HUC6 to identify the fish units that are associated with a HUC6/Subwatershed.
- SBP with CBFWA -This data set represents an attempt to delineate and describe individual populations of salmon or steelhead at the HUC6 scale in the Columbia Basin based on information primarily generated by reviewing the Columbia subbasin plans (SBP) created in the 2000-2005 by the Northwest Power and Conservation Council planning process. During 2007, fish managers affiliated with the Columbia Basin Fish & Wildlife Authority (CBFWA) reviewed these population definitions and made suggested revisions. For more information about this data set, please read the metadata.
- HSRG – This data set represents the Columbia Basin hatchery populations that were reviewed for reform by the Hatchery Scientific Review Group (HSRG) under a US Congressional directive. The pop/units’ information came from descriptions in the population reports produced at the end of a yearlong process (2009) located in the Hatchery Reform website. For more information about this data set, please read the metadata.
- NOAA TRT – This data set represents the historical National Oceanic and Atmospheric Administration Technical Recovery Teams (NOAA TRT) spatial data and attributes for the listed ESU populations for the Lower and Interior Columbia Basin, that was available at the time the Crosswalk was built (2012/13). TRT data is mostly based on the HUC 6 boundaries, but the TRT have made an effort to delineate passage barriers and therefore have split some HUCs for mapping populations. The Crosswalk project did not split HUCs for mapping, so TRT maps and Crosswalk maps will differ slightly. Information on TRT HUC designations can be found in the reports produced for the Crosswalk. TRT data includes HUCs that are both accessible and inaccessible as fish habitat. In the crosswalk map, we only show currently accessible HUCs and areas where trap and haul occurs, but information on inaccessible HUCs are included in the tabular reports. For more information about this data set, please read the metadata. Today NOAA has a webpage for viewing maps and downloading spatial data for the species under their management. To see the latest spatial and attribute data on salmon and steelhead populations defined by NOAA please click here. There have been updates to populations’ spatial locations, names, runs, etc. compared to the data available in 2013.
- CRITFC – The Columbia River Inter-Tribal Fish Commission has added and will continue to add the populations of supplementation and reintroduction programs of our member tribes that have occurred since the subbasin plans were developed in 2005. Many of the recent programs are reintroducing sockeye and coho salmon back into their native lakes and rivers in the interior Columbia Basin. For more information about this data set, please read the metadata.
- WDFW – This data set represents the Washington Department of Fish and Wildlife (WDFW) delineation and description of individual populations of salmon and steelhead the agency manages within the Columbia Basin. Where NOAA/TRT defined populations exist in Washington, WDFW uses the NOAA/TRT population names and boundaries. Where populations are not defined by NOAA/TRT, WDFW uses the delineations and descriptions from the Salmonid Stock Inventory (SaSI) database. For more information about this data set, please read the metadata.
- ODFW – This data set represents the Oregon Department of Fish and Wildlife (ODFW) delineation and description of individual populations of salmon and steelhead the agency manages within the Columbia Basin. Where NOAA/TRT defined populations exist in Oregon, ODFW uses the NOAA/TRT population names and boundaries. Where populations are not defined by NOAA/TRT, ODFW uses the delineations and descriptions from the 2005 Oregon Native Fish Status Report. For more information about this data set, please read the metadata.
- Colville/Canada – This data set represents the delineation and description of individual salmon and steelhead populations in the Columbia Basin, co-managed by the Confederated Tribes of the Colville Reservation and the Washington State Department of Fish and Wildlife. These populations cross the United States – Canada border, where HUC 6 boundaries do not exist. Therefore, a spatial data set of the watershed and fish pop/unit boundaries in Canada is used for fish management purposes and is available for download. For more information about this data set, please read the metadata.
- IDFG – The Idaho Department of Fish and Game Fisheries Bureau uses the names and defined population boundaries mapped in the NOAA TRT data sets for Idaho. They do not maintain boundaries for formal populations that are not listed under the ESA.
BASE DATA:
- WBD – The HUC 6 boundaries of the national Watershed Boundary Dataset are the main spatial data for this project. The HUC 6 is the unit for querying data or displaying pop/units and their tabular data. This dataset is on all the maps and will display as the user zooms to a fine scale.The Population Query tool uses HUC 4 spatial extent as a choice to help narrow down the fish populations returned in the query results. The HUC 6s were rolled up to the larger HUC 4 basins and are available on all the maps and can be used in conjunction with the Population Query choices to find the populations on a map.
- Fish Distribution – Stream distribution of fish species and run, obtained from the StreamNet project of the Pacific States Marine Fisheries Commission via a web service. Includes known distribution extents for Chinook (spring/summer/fall), Steelhead (winter/summer), Coho, Chum, and Sockeye Salmon and Kokanee. Distribution is broken into spawning, rearing, and migration use types. Data is updated regularly by the StreamNet project.
- Rivers/Streams – The maps have several layers of line work representing the rivers/streams system of the Columbia Basin; each is a representation of the system at a different scale and each will appear or disappear as the zoom tools are used to zoom in and out.
- Columbia Basin – a general boundary layer for display at course scale.
- Columbia Subbasins – a boundary layer of the subbasins as defined by the Northwest Power and Conservation Council’s Fish and Wildlife Program for the subbasin plans. The spatial data will display at mid-range scale for reference – one of the fish pop/units datasets came from the subbasin planning process and plans written in the early 2000s.
- ESUs – general boundary layers for display at course scale of the Evolutionarily Significant Unit (ESU) of salmon and steelhead from NOAA’s National Marine Fisheries Service. The ESU boundaries were updated in March, 2013 from NOAA to match TRT population boundaries and the Watershed Boundary Dataset.
- Basemaps – a set of nine background reference rasters to choose from for background information in the maps (imagery, topography, roads, places, etc.) provide the user a way to refine their location on the earth. Note that many data layers (fish, rivers, watersheds) are not at the same fine resolution as some of the imagery and therefore should be considered a rough estimate of location on the image.